Analytics
This module provides the infrastructure necessary to use OLAP Cubes in Openbravo.
- License: Commercial
- Category: Module
This module has been created in order to enhance Openbravo with the ability to do Analytical Analysis. This module provides the basic infrastructure and tools for Analytical Reporting.
With this module it is possible to define an OLAP Cube through Application Dictionary and then use it to create Analytical Reports.
|
Disclaimer Analytics is a complete solution and a very powerful tool. For the end user it is very intuitive and easy to use too. But it also hides a large complexity behind, that needs to be understood before performing advanced actions. Therefore, based on it's level of complexity, three different levels of Roles can be defined:
|
|
Disclaimer Openbravo Analytics is a Business Intelligence Tool. Like other BI tools, it has been created to achieve excellent performance with Analytical Reports. Analytical Reports are meant to show meaningful information without plenty of data. Not like flat Reports which shows a lot of data, but it is really hard to understand the information that it conveys. An example of a flat Report can be the General Ledger Report. It shows a lot of data that can be analyze, but it is not easy to understand the situation without investing some time analyzing the data. On the other hand, a chart with the profits of the companty for the last 5 years is an Analytical Report. With a quick glance, the user can fully understand the situation of the company. Openbravo Analytics has a good performance with Analytical Reports, but it does not perform correctly with flat reports. For this scenario, it is advised to create a normal Report using JasperReports Explanation: In order to have great performance with Analytical Reports, Openbravo Analytics calculates all the possible combinations with all the dimensions. If a report has:
It needs to do 100 to the 10 calculations 1.000.000 times. In total 10 to the 17 calculations! The fact of having 10 dimensions will kill the performance. Also, if the goal is to show meaningful information with a quick glance, there is no point on having so many dimensions |
Introduction
A brief explanation about OLAP Cubes and the technologies that Openbravo uses to implement them.
Intro-Video
See this great video for a 2 minutes overview.
Resources
Some of the most interesting On-Line external resources that are helpful for understanding the underlying technologies and concepts in Openbravo Analytics:
- About Saiku it is adviced to check their own [1]
- About Mondrian at Pentaho it is also adviced to look into their the Documentation
- A great set of tutorials on the MDX query language, like the articles from William E. Pearson, III, in the section 'MDX Essentials' on this link. The tutorial series starts with this one.
Installation and Configuration
An explanation of how to install and configure the Analytics Module.
For more advanced topics on Mondrian configuration, refer to the developers section below, which has a more extensive explanation in that regard.
User Guide
Once Analytics Module is installed and configured the user has access to a set of tools to consume Multi-Dimensional Reports
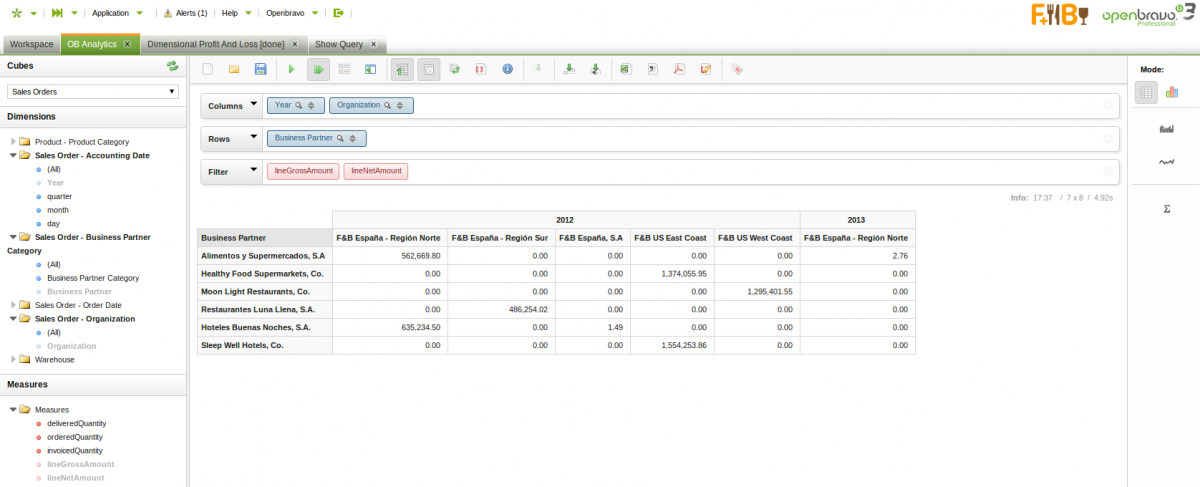
OB Analytics
This is the main Window from which Multi-Dimensional Reports can be explored. The User will have access to a Window named Multi-Dimensional Reports, which is a limited version of OB Analytics Window. therefore not all the functionality detailed will be available to this Role.
Openbravo Sales Reports, Views, Widgets, Cubes
Openbravo Analytics provides several different instruments to help you with your reporting and analytics requirements.
- Analytics Reports visualize key sales information. Allowing you to look at anything from best sellers, discounts, cashup information, detailed return overviews.
- Analytics Windows provide detailed insight in the sales facts which are used to fill the reports and widgets. You can use the standard Openbravo tooling to filter, sort, re-organize your data before exporting it to excel.
- Analytics Widgets give you direct insight in best performing products (categories) across stores and provides usefull KPI's on sales rep productivity.
Multi-Currency, Hierarchies & Date Time Mapping
This page discusses several topics which are important to understand when working with OB Analytics.
How To
Consultant's Guide
Once Analytics Module is installed and configured the consultant has access to a set of tools to consume and also to create Multi-Dimensional Reports for the end user
OB Analytics
This is the main Window from which Multi-Dimensional Reports can be explored.
Stored Views
It is possible to save a Multi-Dimensional Query and then to launch it again through a different Window. This makes it possible to construct a specific view using Analytics and then make it available to only specifically selected users.
How To
Developer's Guide
Cube Definition
Cubes are defined through the Application Dictionary. Cubes can be modified or created using the Cube Definition Window.
Security and Access
How security and authorized access are handled with Analytics.
Create, Update and Extend Fact tables using Openbravo's Fact Table infrastructure
Openbravo provides an infrastructure to control the updating of separate fact tables from transaction tables. This section discusses how to setup and extend existing fact tables and how to incorporate your code and custom columns in the standard Openbravo Fact Update infrastructure.
Cube Queries in Process Windows and Widgets
It is possible to embed a Multi-Dimensional Query into a Widget or a Process Definition Window to show the results.
Managing time/date columns and Parent-Child relations in Mondrian
Discusses complex mapping topics, for example how date/time properties and parent-child relations are mapped.
XMLA/Excel/xmla4js
Using the XMLA webservice api with Analytics
Configuration and Development
How to configure Mondrian to improve performance and tips for when developing using the Analytics infrastructure.
Limitations
Known limitations of Mondrian/Analytics Module.
Analytics Cubes, Reports, Widgets and Views
Openbravo Analytics provides several different instruments to help you with your reporting and analytics requirements.
The Analytics Reports visualize key sales information. Allowing you to look at anything from best sellers, discounts, cashup information, detailed return overviews.
The Analytics Windows provide detailed insight in the sales facts which are used to fill the reports and widgets. You can use the standard Openbravo tooling to filter, sort, re-organize your data before exporting it to excel.
The Analytics Widgets give you direct insight in best performing products (categories) across stores and provides usefull KPI's on sales rep productivity.
These data analysis tools are based on a set of extendable cubes provided out-of-the-box with Openbravo Analytics. Openbravo Cubes will help you in creating reports with information such as:
- Sales by product and product category for a specific period, net sales as well as gross sales, by business partner.
- Discounts and promotions applied with total discount amount by period/product category
- Daily/weekly sales report showing sales and returns by product and product category for different customer types
- Margin by sales
- Sales information by zipcode/region
Sales Terminology - Fields
When using the analytics cubes/reports you will see the same terminology/field names repeatedly being used. This section describes the meaning of those fields, especially sales versus returns and negative versus positive numbers is important to understand:
- Sales: is the sales amounts excluding returns, excluding taxes but including discounts. It is always a positive number or zero.
- Returns: is the return amounts including discounts and excluding taxes, it is a positive number or zero.
- Net Sales: is Sales - Returns, including their discounts, excluding taxes, can be a negative number if more is returned than sold.
- Quantity: is the sold quantity excluding returns, is always a positive number or zero
- Returned Quantity: is the returned quantity represented as a positive number or zero
- Net Quantity: is Quantity - Returned Quantity, can be negative if more is returned than sold
- Cost: is the cost of the sold products, computed for the time of being shipped, excludes returns, is always a positive number or zero
- Returns Cost: cost of the returned items, is a positive number or zero
- Net Cost: cost of goods sold minus cost of goods returned, can be negative if more is returned than sold
- Discount: discount amount of goods sold, excluding returns, is a positive number or zero
- Returns Discount: discount amount of returned goods, is a positve number or zero
- Net Discount: discount of goods sold minus discount on returned goods, is a negative number if more is returned than sold
This same base terminology is also used for other definition, for example Tax: Tax, Returned Tax, Net Tax.
In addition several cubes have these computed measures:
- Gross Margin: net sales minus net cost
- Gross Margin %: Gross Margin/Net Sales
- Mark Up %: (Net Sales - Net Cost)/Net Cost
- Discount %: Net Discounts / (Net Sales + Net Discounts)
- Return Quantity %: Returned Quantity/Quantity

Understanding Analytics: hiding empty results
Analytics reports are very flexible and will try to only show relevant information to you. As a default the reports will hide empty rows and columns. If your filter parameters result in no results then nothing is shown.
Another reason that your report won't show data is that you have a date filter which is too wide, for example setting a start date to 1 Jan 1970. So the date filtering should use dates which are within a sensible timeframe corresponding to the operational time frame of your business data.
To show also the empty cells/values click this button which is shown in the toolbar above the analytics report:
![]()
Analytics Reports
This section gives an overview of the standard reports delivered as part of the Openbravo (Retail) Analytics modules. The reports are based on the cubes which are described at the end of this wiki page.
Report Sales by Organization - Payment Method
Shows the net sales amount by payment method across different organizations. This report is based on the Sales Details Cube.
You can filter by business partner and business partner category. If you don't filter by business partner or business partner category the report is shown for the all business partner category, in the report you can zoom to the business partner categories by left-clicking on the 'all business partner category' and selecting show children.

Report Sales: Best Sellers & Sales by Product Category
This report is based on the Sales Details Cube. It shows two analytics reports:
- sales, cost, return and margin information for the top 10 best selling products
- sales, cost, return and margin information by product category, you can zoom into the products for each product category
Both reports are sorted descending by net sales.
Top 10 best selling products:

Sales by product category, note you can zoom to product level by left clicking on a product category and select show children:

Report Sales Productivity by Sales Rep
Shows for a selected store the sales productivity KPI's by sales rep. Productivity KPI's are order/ticket count, average quantity/amount etc. This report is based on the Sales Header Cube.

Report Sales Productivity by Store
Shows for a selected store the sales productivity KPI's by sales rep. Productivity KPI's are order/ticket count, average quantity/amount etc. This report is based on the Sales Header Cube.

Report Sales Returns Overview by Sales Rep
Provides a view on the returns by sales rep showing order count and average return amounts and quantities. This report is based on the Sales Header Cube.

Report Cashup Summary
Gives a summary of the cashup information by closing user/sales rep. You can zoom in on the business date by left-clicking the all business date in the column header and select show children. This report is based on the Sales Cashup Cube.

Report Discounts by Store, Sales Rep and Product dimensions
The report shows the discount amounts by type of discount against several dimensions.
See the screenshot below, you can zoom to the details of each of the dimensions by left-clicking and selecting show children.

Analytics Windows
The Analytic Windows offer a great way to download/filter the fact data using standard Openbravo grid tooling. The fact table views support things like:
- column filtering
- saved views
- sorting
- column hiding/showing/re-organizing
- summary functions and computed columns
- grouping (for smaller datasets)
One of the most important features is that you can easily export the filtered data to excel (through the csv option).
Note:
- An important additional feature provided by the fact table views is that you can edit the facts directly.
- This makes is possible to correct unrealistic data facts which occurred to possibly correct data.
- You can not remove fact records as the system would just create new one. If a fact later on changes in the transactional tables it is possible that any of your manual overwrites is overwritten.
- The fact table views do not do advanced data validation. So you should be aware that there is a lot of freedom in updating information. This is allowed because there are no critical business processes reading the fact tables. The fact tables stand really apart from the transactional tables.
Analytics Sales Details View
Provides a direct view of the individual records which form the basis of the data in the Sales Details Cube. You can not delete records but edit the measure fields and some of the dimension fields.

Analytics Sales Header View
Provides a direct view of the individual records which form the basis of the data in the Sales Header Cube. You can not delete records but edit the measure fields and some of the dimension fields.

Analytics Cashup Details View
Provides a direct view of the individual records which form the basis of the data in the Sales Cashup Cube. You can not delete records but edit the measure fields and some of the dimension fields.

Analytics Sales Discounts View
Provides a direct view of the individual records which form the basis of the data in the Sales Discounts Cube. You can not delete records but edit the measure fields and some of the dimension fields.

Analytics Widgets
The (Retail) Analytics module provides several widgets which can be added to the OB workspace. Most of the widgets have a date from and to parameter. Other dimensions are pre-set.
Note: The widgets use the currency of the current organization or client, which ever is set.

Best Products
Lists all the products in decreasing net sales values, shows an important subset of the sales, returns and cost and margin measures of the Sales Details Cube.

Top Products by Store
Lists the top number of products for each store, sorted by decreasing net sales values, including the store dimension, shows an important subset of the sales, returns and cost and margin measures of the Sales Details Cube.
You can set the number of products to show for each store (Top Count).

Best Product Categories
Lists all the product categoriess in decreasing net sales values, shows an important subset of the sales, returns and cost and margin measures of the Sales Details Cube.

Top Product Categories by Store
Lists the top sold (net sales) product categories by store in decreasing net sales values, including the store dimension, shows an important subset of the sales, returns and cost and margin measures of the Sales Details Cube.
You can set the number of categories to show for each store through the topCount parameter.

Best Sales Rep by Store
Lists all the sales reps in decreasing net sales values, including the store dimension, shows an important subset of the sales, returns and cost and margin measures of the Sales Details Cube.

Best Store
Lists all the store in decreasing net sales values. Shows an important subset of the sales, returns and cost and margin measures of the Sales Details Cube.

Sales Rep Productivity
List the sales productivity KPI's of the sales reps in decreasing order/ticket count. Is based on the Sales Header Cube.

Store Productivity
List the sales productivity KPI's of the store in decreasing order/ticket count. Is based on the Sales Header Cube.

Openbravo Cubes
Openbravo provides cubes for retail environment as well as non-retail environments.
The analytics cubes are defined in the Application Dictionary using a Cube Definition. You can extend the default Cubes with your own dimensions. If you can make use of existing columns in the fact table then this only requires adding new dimensions to the Cube Definition. If you need more/other columns then you need to do a small custom development activity. See here for more information.
The subsequent sections each describe the standard cubes delivered by Openbravo.
Sales Details Cube
The sales details cube is based on the invoice line table, from this table related information is read from:
- invoice header
- sales order header and line
- discounts
The following filter is applied, so only these records are copied to the fact table:
- invoice status is completed ('CO')
- invoice line must have a sales order line set
- it is a sales transaction
- the documenttype of the invoice header is not a reversal document type

Dimensions
The sales details cube has the following dimensions
- Organization/Store: from the invoice line
- Sales/Invoice-To Business Partner and Business Partner Category: from the invoice header
- Sales/Invoice-To Business Partner Location/Address, region, country: from the invoice header
- POS Terminal & POS Terminal Type: from the order header
- Tax and Tax Category: from the invoice line
- Generic Product/Product Category from invoice line product
- UOM and Currency: from the invoiceline/invoiceheader
- Sales Campaign: from the invoice header
- Project: from the invoice header
- Sales Rep: from the invoice header
- Payment Term: from the invoice header
- Payment Method: from the invoice header
- Product/ProductCategory: from the invoice line
- ProductCategoryHierarchy: a special dimension which combines product and productcategory in one dimension
- Document Type/Transaction Document Type: from the sales order header
- Financial Dimensions (user1 and user2): from the invoice line or if not set there from the invoice header
- Date order/promised/delivered/scheduled delivery date: from the order header
- Invoice date: from the invoice header
- PriceList: from the invoice line
- Discount/Promotion (from version 1.2.110): one of the discount/promotion used on the invoice line, only relevant if there is one discount applied in the order line
Additional dimensions from module version 1.2.200 onwards:
- City Name: city of the partner address
- Postal Code: postal code of the partner address
- Month: month - from the order date
- Time: time (24 hour clock) - from the created date (note: is the time in the server time zone)
- Hour: hour (24 hour clock) - from the created date (note: is the hour in the server time zone)
- Week day: weekday, sunday is first day of the week - from the order date
- Week number: week number of the year, first week has number 1 - from the order date
- Year: year as a number - from the order date
- Birthdate: birthdate of the user linked to the business partner of the order
Note for new dimensions to be applied the fact tables need to be cleared and recomputed.
In addition the Retail Analytics module adds the following dimensions
- POS Terminal and POS Terminal Type (provided by the retail analytics module), from the sales order header
- Business Date, from the sales order header
Measures
- Unit Price: from invoice line, aggregation function: average
- Cost/Net Cost/Return Cost: the cost is computed using the value of the inventory transaction related to the delivery of the quantity to the customer. From the shipment line the material transaction and related transaction cost record are retrieved, the cost/currency in that record are used.
- List Price: from invoice line, aggregation function: average
- Discount: from the invoice line
- Quantity: equal to the invoiced quantity, if the invoiced quantity is larger than zero, otherwise zero
- Quantity Returned: from the invoice line, positive number, only set if the invoiced quantity < 0
- Net Amount: invoice line line net amount
- Amount: equal to line net amount if > 0, else zero
- Return Amount: equal to (line net amount * -1) if line net amount < 0, else zero
- Tax Net Amount: sum of the tax amount of the line taxes
- Tax Amount: equal to line net tax amount if > 0, else zero
- Tax Return Amount: equal to (line net tax amount * -1) if line net tax amount < 0, else zero
- Discount Net Amount: sum of line discounts
- Discount Amount: equal to Line Net Discount Amount if > 0, else zero
- Discount Return Amount: equal to Line -1 * Net Discount Amount if < 0, else zero
- Direct Discount Net Amount: (QtyOrdered * PriceList) - LineAmt
- Direct Discount Amount: (QtyOrdered * PriceList) - LineAmt when LineAmt > 0
- Direct Discount Return Amount: -1 * ((QtyOrdered * PriceList) - LineAmt) when LineAmt < 0
- Overridden Amount: the original amount before discounting, (100 * line-net-amount) / (100 - invoiceline.discount)
- Gross Margin: net sales minus net cost
- Gross Margin %: Gross Margin/Net Sales
- Mark Up %: (Net Sales - Net Cost)/Net Cost
- Discount %: Net Discounts / (Net Sales + Net Discounts)
- Return Quantity %: Returned Quantity/Quantity
For each type of amount/quantity the following rule applies:
- Net amount: is the sum of the net amounts on the line, returns are counted as negative amounts, so this is the balance of sales and returns.
- Amount: is only the sales amount, so returns are not part of this amount figure.
- Return amount: is the return amount, represented as a positive number, so returned quantities/amounts are summed as positive numbers.
Sales Header Cube
The sales header cube provides sales information on ticket/order level. This is useful for getting sales productivity information related to number of orders/tickets and average amount by order.
The sales header cube is based on a separate fact table filled from the sales order header table. The following sales orders are used to fill the fact table:
- salesTransaction orders
- document status is completed
- document type is not reversal
Related information is read from the order lines and discounts.

Dimensions
The main dimensions are all read directly from the sales order header:
- Organization/Store
- Sales Organization: the direct organization of the order mapped without the org tree.
- Sales/Invoice-To Business Partner and Business Partner Category
- Sales/Invoice-To Business Partner Location/Address, region, country
- Currency
- Sales Rep
- Payment Method
- Document Type/Transaction Document Type
- Date ordered/scheduled delivery date
Additional dimensions from module version 1.2.200 onwards:
- City Name: city of the partner address
- Postal Code: postal code of the partner address
- Month: month - from the order date
- Time: time (24 hour clock) - from the created date (note: is the time in the server time zone)
- Hour: hour (24 hour clock) - from the created date (note: is the hour in the server time zone)
- Week day: weekday, sunday is first day of the week - from the order date
- Week number: week number of the year, first week has number 1 - from the order date
- Year: year as a number - from the order date
- Birthdate: birthdate of the user linked to the business partner of the order
Note for new dimensions to be applied the fact tables need to be cleared and recomputed.
In addition the Retail Analytics module adds the following dimensions
- POS Terminal and POS Terminal Type (provided by the retail analytics module), from the sales order header
- Business Date, from the sales order header
Measures
- Order Count: a count measure to count the number of orders/tickets
- Quantity: sum of the invoiced quantity from the order lines with a quantity > 0
- Net Quantity: sum of the invoiced quantity from the order lines
- Quantity Returned: sum of the invoiced quantity from the order lines with a quantity < 0
- Net Amount: sum of the order line line net amount
- Amount: equal to sum of the line net amount of lines with line net amount > 0
- Return Amount: sum of the (line net amount * -1) for the lines with line net amount < 0
- Tax Net Amount: sum of the tax amount of the line taxes
- Tax Amount: sum of the line net tax amount for lines with tax amount > 0
- Tax Return Amount: equal to sum of (line net tax amount * -1) of lines with line net tax amount < 0
- Discount Net Amount: sum of line discounts
- Discount Amount: sum of the Line Net Discount Amount for lines with discount amount > 0
- Discount Return Amount: sum of the Line -1 * Net Discount Amount if the line discount amount < 0
- Direct Discount Net Amount: sum((QtyOrdered * PriceList) - LineAmt)
- Direct Discount Amount: sum((QtyOrdered * PriceList) - LineAmt) for lines where LineAmt > 0
- Direct Discount Return Amount: sum(-1 * ((QtyOrdered * PriceList) - LineAmt)) for lines where LineAmt < 0
For each of the above measures also an average measure is made available:
- Average Quantity
- Average Returned Quantity
- Average Net Quantity
- Average Net Amount
- Average Amount
- Average Return Amount
- Average Tax Net Amount
- Average Tax Amount
- Average Tax Return Amount
- Average Discount Net Amount
- Average Discount Amount
- Average Discount Return Amount
- Average Direct Discount Net Amount
- Average Direct Discount Amount
- Average Direct Discount Return Amount
The average is computed using a MDX function by dividing the summed measure by the order count, for example: AGGREGATE([Measures].[Return Tax Amount]) / [Measures].[Order Count]
Sales Cashup Cube
This cube is delivered as part of the retail analytics module.
This cube is based on a combination of cashup details and reconciliation information. It has a separate fact table and uses the OBPOS_App_Cashup as the basis and will create a fact record for each cashup record which is not a reporting cashup record.
The amounts are read from the financial reconcilliation tables.

Dimensions
- Organization/Store for the cashup
- Sales Organization: direct organization/store for the cashup mapped without the organizational tree
- Sales/Invoice-To Business Partner and Business Partner Category
- Sales/Invoice-To Business Partner Location/Address, region, country
- Currency
- Closed by user
- Opened by user
- POS Terminal & POS Terminal Type: from the order header
- Payment Method
Measures
- Opening amount
- Final amount
- Expected Amount
- Differences Amount
Sales Discounts Facts Cube
Allows analyzing discounts by different kind of sales dimensions. The cube is based on the c_invoice_line table with the following characeristic:
- invoice status is completed ('CO')
- invoice line must have a sales order line set
- it is a sales transaction
- the documenttype of the invoice header is not a reversal document type
for each C_InvoiceLine record, the C_InvoiceLine_Offer table is used to create the actual facts.

Dimensions
Dimensions of the cube:
- Organization/Store: from the order line
- Sales/Invoice-To Business Partner and Business Partner Category: from the order header
- Discount and discount type: from C_OrderLine_Offer.M_Offer_Id/M_Offer_Type_ID
- Currency: from the order header/line
- Sales Rep: from the order header
- Payment Method: from the order header
- Sales Organization
- Filter Order Date
In addition the retail analytics module adds these dimensions:
- POS Terminal & POS Terminal Type: from the order header
Measures
- Discount Amount: C_OrderLine_Offer.TotalAmount